8 Plot and Renderer Parameters
| (require plot) | package: plot-gui-lib |
8.1 Compatibility
parameter
(plot-deprecation-warnings? warnings) → void? warnings : boolean?
= #f
8.2 Output
parameter
(plot-new-window? new-window?) → void? new-window? : boolean?
= #f
(plot-new-window? #t)
parameter
(plot-width width) → void? width : exact-positive-integer?
= 400
parameter
(plot-height height) → void? height : exact-positive-integer?
= 400
parameter
(plot-jpeg-quality) → (integer-in 0 100)
(plot-jpeg-quality quality) → void? quality : (integer-in 0 100)
= 100
parameter
(plot-ps/pdf-interactive? interactive?) → void? interactive? : boolean?
= #f
8.3 General Appearance
parameter
(plot-aspect-ratio) → (or/c (and/c rational? positive?) #f)
(plot-aspect-ratio ratio) → void? ratio : (or/c (and/c rational? positive?) #f)
= #f
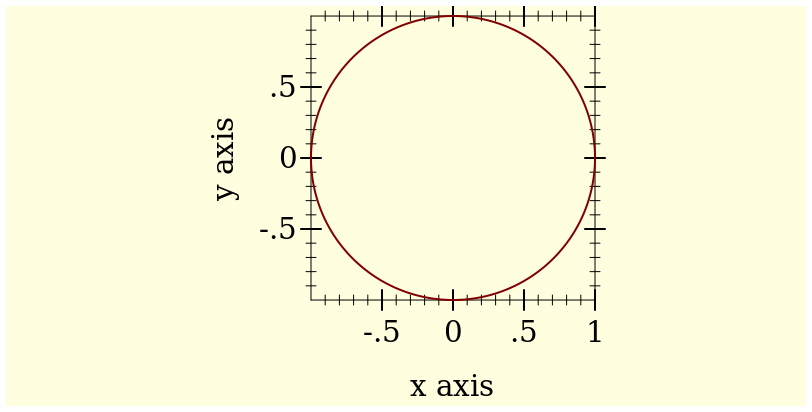
When the aspect ratio is #f, the plot area fill fill the entire area of the plot, leaving room only for the axis labels and title.
When an aspect ratio is a positive number, the plot area will maintain this aspect ratio, possibly leaving empty areas around the plot.
This feature is useful when the aspect ratio needs to be maintained for the plot output to look correct, for example when plotting a circle:
> (parameterize ([plot-aspect-ratio 1] [plot-background "lightyellow"]) (plot (polar (lambda (t) 1)) #:width 400 #:height 200))
Added in version 8.1 of package plot-gui-lib.
parameter
(plot-title) → (or/c string? #f)
(plot-title title) → void? title : (or/c string? #f)
= #f
parameter
(plot-x-label) → (or/c string? #f)
(plot-x-label label) → void? label : (or/c string? #f)
= "x axis"
parameter
(plot-y-label) → (or/c string? #f)
(plot-y-label label) → void? label : (or/c string? #f)
= "y axis"
parameter
(plot-z-label) → (or/c string? #f)
(plot-z-label label) → void? label : (or/c string? #f)
= #f
parameter
(plot-x-far-label) → (or/c string? #f)
(plot-x-far-label label) → void? label : (or/c string? #f)
= #f
parameter
(plot-y-far-label) → (or/c string? #f)
(plot-y-far-label label) → void? label : (or/c string? #f)
= #f
parameter
(plot-z-far-label) → (or/c string? #f)
(plot-z-far-label label) → void? label : (or/c string? #f)
= #f
parameter
(plot3d-samples) → (and/c exact-integer? (>=/c 2))
(plot3d-samples n) → void? n : (and/c exact-integer? (>=/c 2))
= 41
parameter
(plot3d-angle) → real?
(plot3d-angle angle) → void? angle : real?
= 30
parameter
(plot3d-altitude) → real?
(plot3d-altitude altitude) → void? altitude : real?
= 60
parameter
(plot3d-ambient-light) → (real-in 0 1)
(plot3d-ambient-light amt) → void? amt : (real-in 0 1)
= 2/3
parameter
(plot3d-diffuse-light? diffuse?) → void? diffuse? : boolean?
= #t
parameter
(plot3d-specular-light? specular?) → void? specular? : boolean?
= #t
parameter
(plot-line-width) → (>=/c 0)
(plot-line-width width) → void? width : (>=/c 0)
= 1
The line width for plot renderers, such as function and lines, is controlled by the line-width parameter.
parameter
(plot-line-cap cap) → void? cap : plot-pen-cap/c
= 'round
Added in version 8.10 of package plot-gui-lib.
parameter
→ (or/c (>=/c 0) (list (>=/c 0) (>=/c 0) (>=/c 0) (>=/c 0))) (plot-inset inset) → void? inset : (or/c (>=/c 0) (list (>=/c 0) (>=/c 0) (>=/c 0) (>=/c 0)))
= 0
One example use for this parameter is to avoid clipping tick marks when lines for plot elements are very thick, see plot-line-width and line-width. In such a case, the end of axis ticks can be drawn beyond the end point of the line, and might be clipped at the edge of the drawing region. A non-zero plot-inset value can be used to avoid this clipping.
See also plot-legend-padding for an equivalent setting for the plot legend.
Added in version 8.11 of package plot-gui-lib.
parameter
(plot-foreground color) → void? color : plot-color/c
= 0
parameter
(plot-background color) → void? color : plot-color/c
= 0
parameter
(plot-foreground-alpha) → (real-in 0 1)
(plot-foreground-alpha alpha) → void? alpha : (real-in 0 1)
= 1
parameter
(plot-background-alpha) → (real-in 0 1)
(plot-background-alpha alpha) → void? alpha : (real-in 0 1)
= 1
parameter
(plot-font-size) → (>=/c 0)
(plot-font-size size) → void? size : (>=/c 0)
= 11
parameter
(plot-font-face) → (or/c string? #f)
(plot-font-face face) → void? face : (or/c string? #f)
= #f
parameter
(plot-font-family family) → void? family : font-family/c
= 'roman
parameter
(plot-legend-font-size) → (or/c (>=/c 0) #f)
(plot-legend-font-size size) → void? size : (or/c (>=/c 0) #f)
= #f
parameter
(plot-legend-font-face) → (or/c string? #f)
(plot-legend-font-face face) → void? face : (or/c string? #f)
= #f
parameter
(plot-legend-font-family) → (or/c font-family/c #f)
(plot-legend-font-family family) → void? family : (or/c font-family/c #f)
= #f
parameter
(plot-legend-anchor legend-anchor) → void? legend-anchor : legend-anchor/c
= 'top-left
parameter
(plot-legend-box-alpha) → (real-in 0 1)
(plot-legend-box-alpha alpha) → void? alpha : (real-in 0 1)
= 2/3
parameter
→ (list/c (or/c 'columns 'rows) positive-integer? (or/c 'equal-size 'compact)) (plot-legend-layout layout) → void? layout : (list/c (or/c 'columns 'rows) positive-integer? (or/c 'equal-size 'compact))
= '(columns 1 equal-size)
the placement direction ('columns or 'rows)
the number of columns or rows
whether all the entries will have the same size ('equal-size), or the entries will only occupy the minimum size ('compact)
For example, the value '(columns 1 equal-size) will place the legend entries vertically from top to bottom and all entries will have the same height. A value of '(rows 2 'compact) will place legend entries horizontally on two rows – this type of layout is useful when the legend is placed at the top or bottom of the plot.
Added in version 7.9 of package plot-gui-lib.
parameter
→ (or/c (>=/c 0) (list (>=/c 0) (>=/c 0) (>=/c 0) (>=/c 0))) (plot-legend-padding padding) → void? padding : (or/c (>=/c 0) (list (>=/c 0) (>=/c 0) (>=/c 0) (>=/c 0)))
= 0
One example use for this parameter is to avoid clipping thick lines used in legend entries, see plot-line-width and line-width. In such a case, the end of the lines can be drawn outside the border of the legend, a non-zero plot-legend-padding value can be used to avoid this situation.
See also plot-inset for a similar setting for the entire plot image.
Added in version 8.11 of package plot-gui-lib.
parameter
(plot-tick-size) → (>=/c 0)
(plot-tick-size size) → void? size : (>=/c 0)
= 10
parameter
(plot-x-tick-label-anchor anchor) → void? anchor : anchor/c
= 'top
parameter
(plot-y-tick-label-anchor anchor) → void? anchor : anchor/c
= 'right
parameter
(plot-x-far-tick-label-anchor anchor) → void? anchor : anchor/c
= 'bottom
parameter
(plot-y-far-tick-label-anchor anchor) → void? anchor : anchor/c
= 'left
parameter
(plot-x-tick-label-angle angle) → void? angle : real?
= 0
parameter
(plot-y-tick-label-angle angle) → void? angle : real?
= 0
parameter
(plot-x-far-tick-label-angle angle) → void? angle : real?
= 0
parameter
(plot-y-far-tick-label-angle angle) → void? angle : real?
= 0
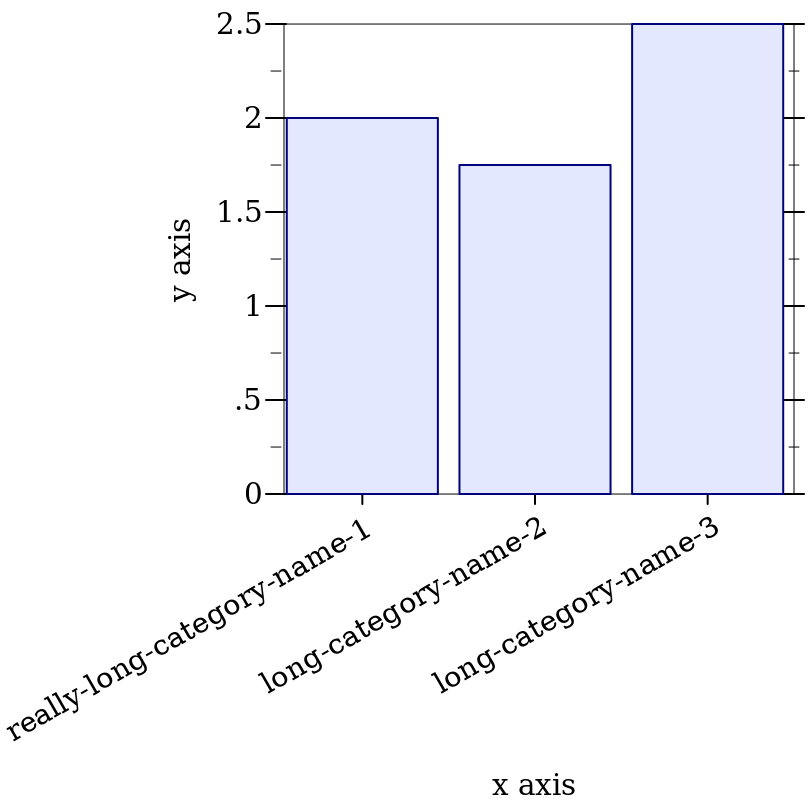
> (parameterize ([plot-x-tick-label-anchor 'top-right] [plot-x-tick-label-angle 30]) (plot (discrete-histogram '(#(really-long-category-name-1 2) #(long-category-name-2 1.75) #(long-category-name-3 2.5)))))
parameter
(plot-x-axis?) → boolean?
(plot-x-axis? draw?) → void? draw? : boolean?
= #t
parameter
(plot-y-axis?) → boolean?
(plot-y-axis? draw?) → void? draw? : boolean?
= #t
parameter
(plot-z-axis?) → boolean?
(plot-z-axis? draw?) → void? draw? : boolean?
= #t
parameter
(plot-x-far-axis? draw?) → void? draw? : boolean?
= #t
parameter
(plot-y-far-axis? draw?) → void? draw? : boolean?
= #t
parameter
(plot-z-far-axis? draw?) → void? draw? : boolean?
= #t
Use these along with x-axis and y-axis renderers if you want axes that intersect the origin or some other point.
parameter
(plot-x-tick-labels? draw?) → void? draw? : boolean?
= #t
parameter
(plot-y-tick-labels? draw?) → void? draw? : boolean?
= #t
parameter
(plot-z-tick-labels? draw?) → void? draw? : boolean?
= #t
parameter
(plot-x-far-tick-labels? draw?) → void? draw? : boolean?
parameter
(plot-y-far-tick-labels? draw?) → void? draw? : boolean?
parameter
(plot-z-far-tick-labels? draw?) → void? draw? : boolean?
parameter
(plot-animating? animating?) → void? animating? : boolean?
= #f
procedure
(animated-samples samples) → (and/c exact-integer? (>=/c 2))
samples : (and/c exact-integer? (>=/c 2))
parameter
(plot-decorations? draw?) → void? draw? : boolean?
= #t
parameter
(plot-pen-color-map) → (or/c symbol? #f)
(plot-pen-color-map name) → void? name : (or/c symbol? #f)
= #f
parameter
(plot-brush-color-map) → (or/c symbol? #f)
(plot-brush-color-map name) → void? name : (or/c symbol? #f)
= #f
If name is not a valid color map name, the internal color map will be used, this is the same as specifying #f.
When the color map value is set to #f, internal color maps will be used, one for pen and one for brush colors. The internal color map used for pen colors has darker and more saturated colors than the one used for brush colors. These colors are chosen for good pairwise contrast, especially between neighbors and they repeat starting with 128.
The color maps available by default are shown below and additional ones can be added using register-color-map:
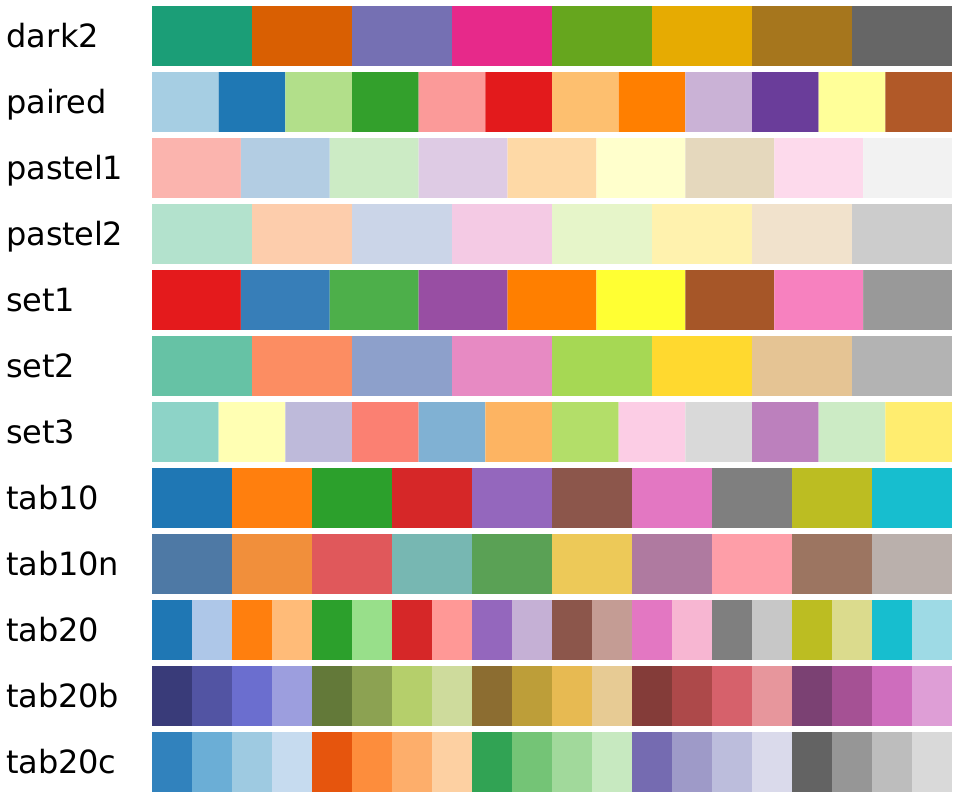
Added in version 7.3 of package plot-gui-lib.
8.4 Lines
parameter
(line-samples) → (and/c exact-integer? (>=/c 2))
(line-samples n) → void? n : (and/c exact-integer? (>=/c 2))
= 500
parameter
(line-color color) → void? color : plot-color/c
= 1
parameter
(line-width) → (>=/c 0)
(line-width width) → void? width : (>=/c 0)
= 1
parameter
(line-style style) → void? style : plot-pen-style/c
= 'solid
parameter
(line-cap cap) → void? cap : plot-pen-cap/c
= 'round
parameter
(line-alpha) → (real-in 0 1)
(line-alpha alpha) → void? alpha : (real-in 0 1)
= 1
Except for line-cap, all other parameters are used as default keyword arguments of function, inverse, lines, parametric, polar, density, isoline, lines3d, parametric3d and isoline3d.
The line-cap parameter applies to lines drawn by renderers in a plot. See also plot-line-cap.
Added in version 8.10 of package plot-gui-lib.
8.5 Intervals
parameter
(interval-color color) → void? color : plot-color/c
= 3
parameter
(interval-style style) → void? style : plot-brush-style/c
= 'solid
parameter
(interval-line1-color color) → void? color : plot-color/c
= 3
parameter
(interval-line1-width) → (>=/c 0)
(interval-line1-width width) → void? width : (>=/c 0)
= 1
parameter
(interval-line1-style style) → void? style : plot-pen-style/c
= 'solid
parameter
(interval-line2-color color) → void? color : plot-color/c
= 3
parameter
(interval-line2-width) → (>=/c 0)
(interval-line2-width width) → void? width : (>=/c 0)
= 1
parameter
(interval-line2-style style) → void? style : plot-pen-style/c
= 'solid
parameter
(interval-alpha) → (real-in 0 1)
(interval-alpha alpha) → void? alpha : (real-in 0 1)
= 3/4
8.6 Points and Point Labels
parameter
(point-sym) → point-sym/c
(point-sym sym) → void? sym : point-sym/c
= 'circle
parameter
(point-size) → (>=/c 0)
(point-size size) → void? size : (>=/c 0)
= 6
parameter
(point-alpha) → (real-in 0 1)
(point-alpha alpha) → void? alpha : (real-in 0 1)
= 1
parameter
(point-x-jitter) → (>=/c 0)
(point-x-jitter x-jitter) → void? x-jitter : (>=/c 0)
= 0
parameter
(point-y-jitter) → (>=/c 0)
(point-y-jitter y-jitter) → void? y-jitter : (>=/c 0)
= 0
parameter
(point-z-jitter) → (>=/c 0)
(point-z-jitter z-jitter) → void? z-jitter : (>=/c 0)
= 0
parameter
(point-color color) → void? color : plot-color/c
= 0
parameter
(point-line-width) → (>=/c 0)
(point-line-width width) → void? width : (>=/c 0)
= 1
parameter
(label-anchor) → anchor/c
(label-anchor anchor) → void? anchor : anchor/c
= 'left
parameter
(label-angle) → real?
(label-angle angle) → void? angle : real?
= 0
parameter
(label-alpha) → (real-in 0 1)
(label-alpha alpha) → void? alpha : (real-in 0 1)
= 1
parameter
(label-point-size) → (>=/c 0)
(label-point-size size) → void? size : (>=/c 0)
= 4
8.7 Vector Fields & Arrows
parameter
(vector-field-samples n) → void? n : exact-positive-integer?
= 20
parameter
(vector-field3d-samples n) → void? n : exact-positive-integer?
= 9
parameter
(vector-field-color color) → void? color : plot-color/c
= 1
parameter
(vector-field-line-width) → (>=/c 0)
(vector-field-line-width width) → void? width : (>=/c 0)
= 2/3
parameter
(vector-field-line-style style) → void? style : plot-pen-style/c
= 'solid
parameter
→ (or/c real? (one-of/c 'auto 'normalized)) (vector-field-scale scale) → void? scale : (or/c real? (one-of/c 'auto 'normalized))
= 'auto
parameter
(vector-field-alpha) → (real-in 0 1)
(vector-field-alpha alpha) → void? alpha : (real-in 0 1)
= 1
parameter
(arrows-color color) → void? color : plot-color/c
= 1
parameter
(arrows-line-width) → (>=/c 0)
(arrows-line-width width) → void? width : (>=/c 0)
= 2/3
parameter
(arrows-line-style style) → void? style : plot-pen-style/c
= 'solid
parameter
(arrows-alpha) → (real-in 0 1)
(arrows-alpha alpha) → void? alpha : (real-in 0 1)
= 1
Added in version 7.9 of package plot-gui-lib.
parameter
→ (or/c (>=/c 0) (list/c '= (>=/c 0))) (arrow-head-size-or-scale size) → void? size : (or/c (>=/c 0) (list/c '= (>=/c 0)))
= 2/5
parameter
(arrow-head-angle) → (>=/c 0)
(arrow-head-angle alpha) → void? alpha : (>=/c 0)
= (/ pi 6)
Added in version 7.9 of package plot-gui-lib.
8.8 Error Bars
parameter
(error-bar-width) → (>=/c 0)
(error-bar-width width) → void? width : (>=/c 0)
= 6
parameter
(error-bar-color color) → void? color : plot-color/c
= 0
parameter
(error-bar-line-width) → (>=/c 0)
(error-bar-line-width pen-width) → void? pen-width : (>=/c 0)
= 1
parameter
(error-bar-line-style pen-style) → void? pen-style : plot-pen-style/c
= 'solid
parameter
(error-bar-alpha) → (real-in 0 1)
(error-bar-alpha alpha) → void? alpha : (real-in 0 1)
= 2/3
8.9 Candlesticks
parameter
(candlestick-width) → (>=/c 0)
(candlestick-width width) → void? width : (>=/c 0)
= 1
parameter
(candlestick-up-color color) → void? color : plot-color/c
= 2
parameter
(candlestick-down-color color) → void? color : plot-color/c
= 1
parameter
(candlestick-line-width) → (>=/c 0)
(candlestick-line-width pen-width) → void? pen-width : (>=/c 0)
= 1
parameter
(candlestick-line-style pen-style) → void? pen-style : plot-pen-style/c
= 'solid
parameter
(candlestick-alpha) → (real-in 0 1)
(candlestick-alpha alpha) → void? alpha : (real-in 0 1)
= 2/3
8.10 Color fields
parameter
(color-field-samples n) → void? n : exact-positive-integer?
= 20
parameter
(color-field-alpha) → (real-in 0 1)
(color-field-alpha alpha) → void? alpha : (real-in 0 1)
= 1
Added in version 7.9 of package plot-gui-lib.
8.11 Contours and Contour Intervals
procedure
(default-contour-colors zs) → (listof plot-color/c)
zs : (listof real?)
=
(color-seq* (list (->pen-color 5) (->pen-color 0) (->pen-color 1)) (length zs))
procedure
(default-contour-fill-colors z-ivls) → (listof plot-color/c)
z-ivls : (listof ivl?)
=
(color-seq* (list (->brush-color 5) (->brush-color 0) (->brush-color 1)) (length z-ivls))
parameter
(contour-samples) → (and/c exact-integer? (>=/c 2))
(contour-samples n) → void? n : (and/c exact-integer? (>=/c 2))
= 51
parameter
→ (or/c 'auto exact-positive-integer? (listof real?)) (contour-levels levels) → void? levels : (or/c 'auto exact-positive-integer? (listof real?))
= 'auto
parameter
(contour-colors) → (plot-colors/c (listof real?))
(contour-colors colors) → void? colors : (plot-colors/c (listof real?))
= default-contour-colors
parameter
(contour-widths) → (pen-widths/c (listof real?))
(contour-widths widths) → void? widths : (pen-widths/c (listof real?))
= '(1)
parameter
(contour-styles) → (plot-pen-styles/c (listof real?))
(contour-styles styles) → void? styles : (plot-pen-styles/c (listof real?))
= '(solid long-dash)
parameter
(contour-alphas) → (alphas/c (listof real?))
(contour-alphas alphas) → void? alphas : (alphas/c (listof real?))
= '(1)
parameter
(contour-interval-colors colors) → void? colors : (plot-colors/c (listof ivl?))
= default-contour-fill-colors
parameter
→ (plot-brush-styles/c (listof ivl?)) (contour-interval-styles styles) → void? styles : (plot-brush-styles/c (listof ivl?))
= '(solid)
parameter
(contour-interval-alphas) → (alphas/c (listof ivl?))
(contour-interval-alphas alphas) → void? alphas : (alphas/c (listof ivl?))
= '(1)
8.12 Contour Surfaces
parameter
(contour-interval-line-colors) → (plot-colors/c (listof ivl?))
(contour-interval-line-colors colors) → void? colors : (plot-colors/c (listof ivl?))
= '(0)
parameter
(contour-interval-line-widths) → (pen-widths/c (listof ivl?))
(contour-interval-line-widths widths) → void? widths : (pen-widths/c (listof ivl?))
= '(1/3)
parameter
→ (plot-pen-styles/c (listof ivl?)) (contour-interval-line-styles styles) → void? styles : (plot-pen-styles/c (listof ivl?))
= '(solid)
8.13 Rectangles
parameter
(rectangle-color color) → void? color : plot-color/c
= 3
parameter
(rectangle-style style) → void? style : plot-brush-style/c
= 'solid
parameter
(rectangle-line-color pen-color) → void? pen-color : plot-color/c
= 3
parameter
(rectangle-line-width) → (>=/c 0)
(rectangle-line-width pen-width) → void? pen-width : (>=/c 0)
= 1
parameter
(rectangle3d-line-width) → (>=/c 0)
(rectangle3d-line-width pen-width) → void? pen-width : (>=/c 0)
= 1/3
parameter
(rectangle-line-style pen-style) → void? pen-style : plot-pen-style/c
= 'solid
parameter
(rectangle-alpha) → (real-in 0 1)
(rectangle-alpha alpha) → void? alpha : (real-in 0 1)
= 1
The default pen width of 3D rectangle edges is narrower for aesthetic reasons.
parameter
(discrete-histogram-gap) → (real-in 0 1)
(discrete-histogram-gap gap) → void? gap : (real-in 0 1)
= 1/8
parameter
(discrete-histogram-skip) → (>=/c 0)
(discrete-histogram-skip skip) → void? skip : (>=/c 0)
= 1
parameter
(discrete-histogram-invert? invert?) → void? invert? : boolean?
= #f
parameter
(stacked-histogram-colors colors) → void? colors : (plot-colors/c nat/c)
= (λ (n) (build-list n add1))
parameter
(stacked-histogram-styles styles) → void? styles : (plot-brush-styles/c nat/c)
= '(solid)
parameter
(stacked-histogram-line-colors pen-colors) → void? pen-colors : (plot-colors/c nat/c)
= (stacked-histogram-colors)
parameter
(stacked-histogram-line-widths pen-widths) → void? pen-widths : (pen-widths/c nat/c)
= '(1)
parameter
(stacked-histogram-line-styles pen-styles) → void? pen-styles : (plot-pen-styles/c nat/c)
= '(solid)
parameter
(stacked-histogram-alphas alphas) → void? alphas : (alphas/c nat/c)
= '(1)
8.14 Non-Border Axes
parameter
(x-axis-ticks? ticks?) → void? ticks? : boolean?
= #t
parameter
(y-axis-ticks? ticks?) → void? ticks? : boolean?
= #t
parameter
(x-axis-labels? labels?) → void? labels? : boolean?
= #f
parameter
(y-axis-labels? labels?) → void? labels? : boolean?
= #f
parameter
(x-axis-far?) → boolean?
(x-axis-far? far?) → void? far? : boolean?
= #f
parameter
(y-axis-far?) → boolean?
(y-axis-far? far?) → void? far? : boolean?
= #f
parameter
(x-axis-alpha) → (real-in 0 1)
(x-axis-alpha alpha) → void? alpha : (real-in 0 1)
= 1
parameter
(y-axis-alpha) → (real-in 0 1)
(y-axis-alpha alpha) → void? alpha : (real-in 0 1)
= 1
parameter
(polar-axes-number n) → void? n : exact-nonnegative-integer?
= 12
parameter
(polar-axes-ticks? ticks?) → void? ticks? : boolean?
= #t
parameter
(polar-axes-labels? labels?) → void? labels? : boolean?
= #t
parameter
(polar-axes-alpha) → (real-in 0 1)
(polar-axes-alpha alpha) → void? alpha : (real-in 0 1)
= 1/2
8.15 Surfaces
parameter
(surface-color color) → void? color : plot-color/c
= 0
parameter
(surface-style style) → void? style : plot-brush-style/c
= 'solid
parameter
(surface-line-color pen-color) → void? pen-color : plot-color/c
= 0
parameter
(surface-line-width) → (>=/c 0)
(surface-line-width pen-width) → void? pen-width : (>=/c 0)
= 1/3
parameter
(surface-line-style pen-style) → void? pen-style : plot-pen-style/c
= 'solid
parameter
(surface-alpha) → (real-in 0 1)
(surface-alpha alpha) → void? alpha : (real-in 0 1)
= 1
procedure
(default-isosurface-colors zs) → (listof plot-color/c)
zs : (listof real?)
=
(color-seq* (list (->brush-color 5) (->brush-color 0) (->brush-color 1)) (length zs))
procedure
zs : (listof real?)
=
(color-seq* (list (->pen-color 5) (->pen-color 0) (->pen-color 1)) (length zs))
parameter
→ (or/c 'auto exact-positive-integer? (listof real?)) (isosurface-levels levels) → void? levels : (or/c 'auto exact-positive-integer? (listof real?))
= 'auto
parameter
(isosurface-colors) → (plot-colors/c (listof real?))
(isosurface-colors colors) → void? colors : (plot-colors/c (listof real?))
= default-isosurface-colors
parameter
(isosurface-styles styles) → void? styles : (plot-brush-styles/c (listof real?))
= '(solid)
parameter
(isosurface-line-colors pen-colors) → void? pen-colors : (plot-colors/c (listof real?))
= default-isosurface-line-colors
parameter
(isosurface-line-widths pen-widths) → void? pen-widths : (pen-widths/c (listof real?))
= '(1/3)
parameter
(isosurface-line-styles) → (plot-pen-styles/c (listof real?))
(isosurface-line-styles pen-styles) → void? pen-styles : (plot-pen-styles/c (listof real?))
= '(solid)
parameter
(isosurface-alphas) → (alphas/c (listof real?))
(isosurface-alphas alphas) → void? alphas : (alphas/c (listof real?))
= '(1/2)